Tutorial
Tutorial: Set Up the French Fries Experiment
This tutorial shows one simple way to turn the French fries business case into a TaguchiLab project.
The exact numbers are examples. Change them to match your kitchen, equipment, and customers.
1. Write the objective
Start with one sentence:
Create French fries that are crisp outside, soft inside, served quickly, and repeatable during normal lunch service.
This sentence keeps the experiment connected to business objectives instead of chasing a vague idea of “better fries.”
2. Write the limitations
List the constraints before choosing the experiment.
- One fryer is available.
- Staff can run only a small number of test batches.
- Oil cost matters.
- Customers will not wait for a slow process.
- The process must be simple enough to train.
These limitations help you avoid testing levels that cannot become part of the real process.
3. Choose the factors
Pick a small set of factors that the team can control.
| Factor | Level 1 | Level 2 | Level 3 |
|---|---|---|---|
| Cut thickness | Thin | Medium | Thick |
| Soak time | 0 minutes | 20 minutes | 40 minutes |
| Oil temperature | 165 C | 175 C | 185 C |
| Fry time | 3 minutes | 4 minutes | 5 minutes |
This is enough to learn something useful without turning the test into a full research project.
4. Choose the single response input
TaguchiLab has one response input per combination. That means you should not try to enter crispness, texture, taste, speed, and waste as separate app values in the same experiment.
Choose one of these approaches before running the batches:
Option A: Use a primary response
Use this when one result matters most for the first experiment.
Example: enter only crispness from 1 to 5.
Option B: Use a composite quality score
Use this when the business decision must balance several things.
Example scoring rule:
- Crispness: 1 to 5
- Inside texture: 1 to 5
- Taste: 1 to 5
- Speed: 1 to 5, where 5 means fast enough for lunch service
- Waste: 1 to 5, where 5 means low waste
Then calculate one composite quality score for each batch. A simple beginner rule could be:
Composite quality score = crispness + inside texture + taste + speed + waste
Enter that one composite quality score in TaguchiLab. Keep the separate notes in a notebook or spreadsheet if you want to understand why one run scored better than another.
Use the same scoring rule for every run. Consistent measurement matters more than perfect measurement.
5. Choose the response direction
After choosing the response value, choose how TaguchiLab should read it:
- Larger is better when a higher number means a better result. Use this for crispness score, taste score, customer rating, or a composite quality score where more points mean better fries.
- Smaller is better when a lower number means a better result. Use this for time to serve, oiliness, waste, defects, complaints, or cost.
For the composite quality score above, choose Larger is better because a higher total means a better batch. If you decide to optimize waste grams instead, choose Smaller is better because less waste is the goal.
6. Create the project in TaguchiLab
In TaguchiLab:
- Create a new experiment project.
- Add the factors.
- Add the levels for each factor.
- Add the primary response or composite quality score you want to optimize.
- Choose whether the response is Larger is better or Smaller is better.
- Use the planned runs to guide each test batch.
- Enter one response value after each batch.
The app is not deciding the business goal for you. It helps keep the experiment structure clear so you can compare the results.
7. Run the test batches
Run the batches as consistently as possible.
- Use the same potato weight for each batch.
- Keep staff instructions simple.
- Record results immediately.
- Do not change extra things during the test.
If something unusual happens, write it down. A busy fryer, wet potatoes, or a timing mistake can explain a strange result later.
8. Read the result as a business decision
When the runs are complete, compare the response values against the objective.
The best robust process may not be the crispiest batch if that batch is too slow or wastes too much product. A better decision may be the setting that gives very good crispness, acceptable service time, low waste, and a process the team can repeat.
That is the Taguchi mindset: improve the process using evidence, while staying inside the real limits of the business.
9. Read the main effects graph
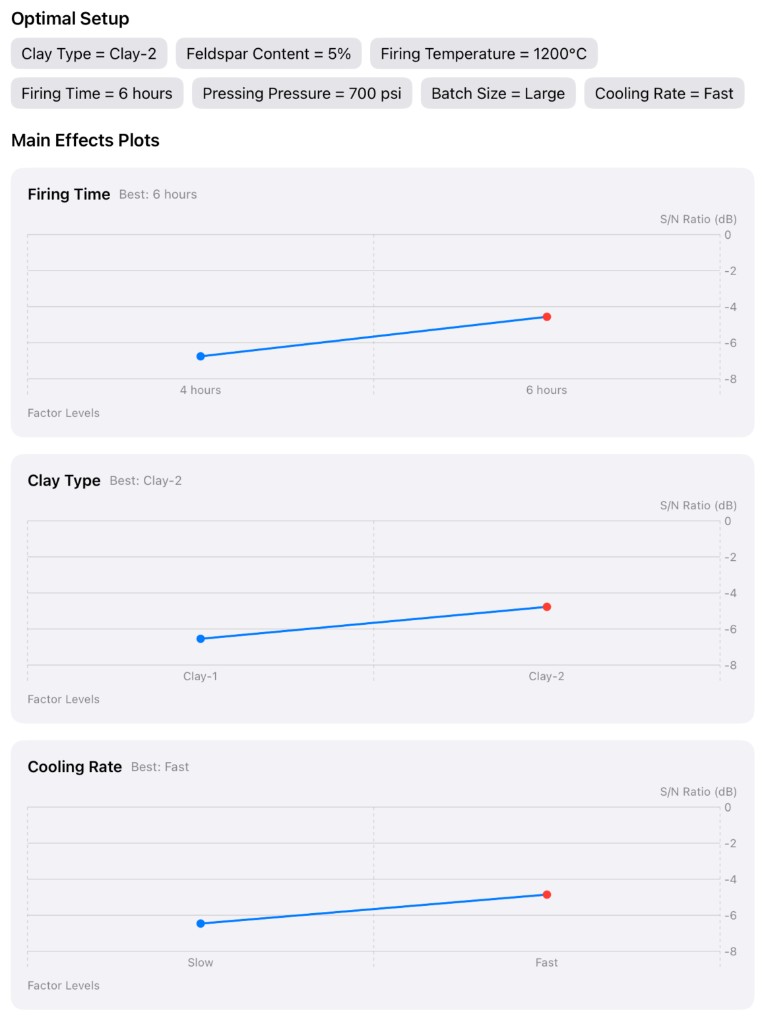
The Optimal Setup chips at the top summarize the factor levels TaguchiLab selected from the experiment. In the screenshot, each chip is one chosen level, such as a clay type, firing temperature, firing time, pressure, batch size, or cooling rate. In the fries example, this would be the selected cut thickness, soak time, oil temperature, fry time, and other tested levels.
Because Taguchi designs test a fraction of all possible combinations, the optimal setup might be a setup you actually tested, or it might be a theoretical one that wasn’t part of your specific run matrix. The app will label this section as either Optimal Setup · Matches Run X (if it perfectly matches one of your runs) or Optimal Setup · Predicted Configuration (if the math shows the best result comes from a new combination).
The Main Effects Plots explain why those levels were selected. Each chart shows one factor. The horizontal axis lists that factor’s levels. The vertical axis shows the S/N Ratio. S/N means signal-to-noise: it is the Taguchi measure used to prefer combinations that perform well and stay stable under variation.
The red point marks the Best level for that factor. A rising line means the level on the right produced a better S/N Ratio for the chosen response direction. A falling line would mean the level on the left is better. A flat line means that factor did not change the response much in the tested range.
Read the graph as a decision aid, not as decoration. The strongest slopes show the factors that changed the response most. The best levels across the plots combine into the optimal setup. After that, run a confirmation batch with those settings before changing daily work.
10. Confirm before changing daily work
Run one or two confirmation batches with the selected settings.
If the fries are still crisp, soft inside, fast enough, and repeatable, document the process for the team. If not, review the factor choices, levels, and response scoring rule, then run a smaller follow-up experiment.